This resource will help you:
The results section should answer the question: what did you find? Here we want to communicate our findings to the reader in a way that clearly shows any trends or patterns and is easy to follow. To do this, we can present our results graphically (figures), tabularly (tables), or textually (written text) depending on the type of results we have. Often, a combination of all three formats is used (Nair & Nair, 2014; Teodosiu, 2019). Remember – do not explain, discuss, or interpret what these results mean (that happens in the discussion).
Usually, any result that is not presented as a table or written text is considered a figure, including:
Examples of figures you may use in your scientific reports are shown below in Figure 1 (Meloncelli, 2019).
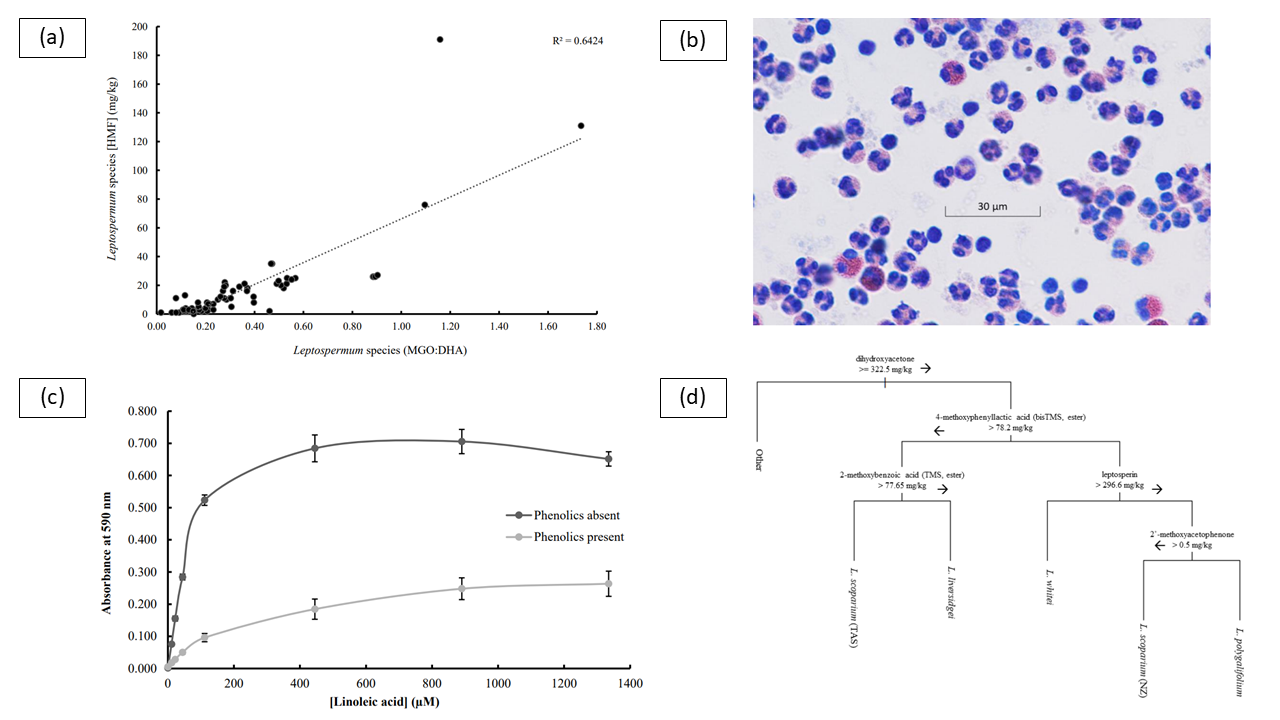
Figure 1. Examples of data visualisation, including (a) scatter plot with regression line, (b) microscope slide photograph, (c) line graph, and (d) classification tree (Meloncelli, 2019).
Tabular results can range from simple two column tables to larger more complex tables. The information presented in a table should help the reader to easily compare data across rows (horizontally) or columns (vertically). Table 1 below from Meloncelli (2019, p. 116) is a good example of a table.
| Chemical standard | Retention time (min) | UV-Vis maxima (nm) | UV-Vis quantify (nm) | Calibration (R2) |
|---|---|---|---|---|
| 2'-Methoxyacetophenone | 11.9 | 210, 245, 300 | 208 | 1.0000 |
| 2-Methoxybenzoic acid | 7.3 | 200, 235, 290 | 236 | 0.9997 |
| 3-Phenyllactic acid | 6.6 | 195, 205sh, 255 | 205 | 0.9986 |
| 4-Hydroxyphenyllactic acid | 2.2 | 195, 225, 275 | 225 | 1.0000 |
| 4-Methoxyphenyllactic acid | 7.3 | 195, 220, 270 | 225 | 0.9999 |
| Leptosperin | 4.3 | 210, 260, 300sh | 260 | 0.9997 |
| Lumichrome | 9.5 | 220, 260 | 225 | 0.9999 |
| Methyl syringate | 9.5 | 220, 270 | 274 | 1.0000 |
While tables and graphs are a great way to concisely present your data, there are a few key points to keep in mind:
Textual results are results that can either be a “stand-alone” description of the results, often from statistical tests, or linked to a graph or table. For instance:
Once you have a good understanding of your results and have prepared any relevant figures and tables, start writing your results section.
Things to consider when writing your results section (Nair & Nair, 2014; Teodosiu, 2019):
This video (23:50 min) from the Saginaw Valley State University (SVSU Science Writing; 2021) provides an overview of the IMRaD results (1:32 min to 9:03 min), information about figures and tables and common mistakes.
Gallo, L. A., Steane, S. E., Young, S. L., de Jersey, S., Schoenaker, D. A. J. M., Borg, D. J., Lockett, J., Collins, C. E., Perkins, A. V., Kumar, S., Clifton, V. L., & Wilkinson, S. A. (2024). Dietary supplements, guideline alignment and biochemical nutrient status in pregnancy: findings from the Queensland Family Cohort pilot study. Maternal & Child Nutrition, 20(1), e13589. https://doi.org/ 10.1111/mcn.13589
Meloncelli, D. (2019). Authentication of Australian and New Zealand honey origins by chromatography, and their anti-inflammatory properties [Doctoral dissertation, University of the Sunshine Coast]. https://doi.org/10.25907/00538
Nair, P. K. R., & Nair, V. D. (2014). Scientific writing and communication in agriculture and natural resources. Springer Cham. https://doi.org/10.1007/978-3-319-03101-9
SVSU Science Writing. (2021, June 29). The IMRaD format: results & discussion [Video]. YouTube.
Teodosiu, M. (2019). Scientific writing and publishing with IMRaD. Annals of Forest Research, 62(2), 201-214. https://doi.org/10.15287/afr.2019.1759